In this section
The Analytics User Experience
Page controls and navigation
The controls described below work the same on any Analytics page where they are present. This quick rundown is intended to orient you to what you see after you login. Details of how you work with each of these controls are provided in other sections of this guide.
The search box provides quick access to individual students and data views. You can enter a partial student name or a student ID number if that is the only information you have.
Click the ReadWrite Digital logo to return to the roster view.

Click the heart to see and save favorites (custom report views).
Click the link to get a link to share your current view.
Click the question mark for help information (like what you are reading!).
The rightmost button will include your avatar, or your initials. You can click it to sign-out of Analytics and see the last time you logged in.
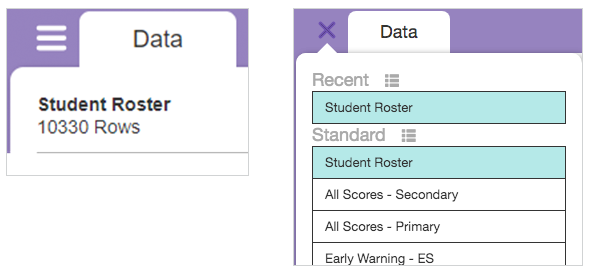
Click the data view menu (the “hamburger” icon with 3 horizontal lines) to see the standard data views available to you and your organization and the last 3 standard views you have recently visited.
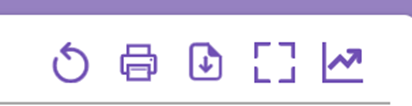
The reset button (circle with arrow) is your “factory reset” for a data view. If you have configured a view but then decide you need to start over, click it.
The print button will print (or save to a PDF) the current data view – all rows and all columns. Since the printed page is limited to its physical dimensions, hide columns you don’t need to print. While you’re at it, filter down to only the rows of data you need to print. The trees will thank you.
Similar to print, the download button will download all rows and columns of your current data view. You can save files as CSV or Excel.
Click the dotted box outline to expand the data grid to the full browser window. Good for presenting on a big screen for team data meetings.
The chart button provides access to advanced group, pivot, and chart functions
Previous: The Analytics User Experience